Tracking your reach
Views, clicks, conversions and tickets, broken down by the channel that produced them, and how to read them without fooling yourself.
6 min readChecked against the live platform on 26 July 2026
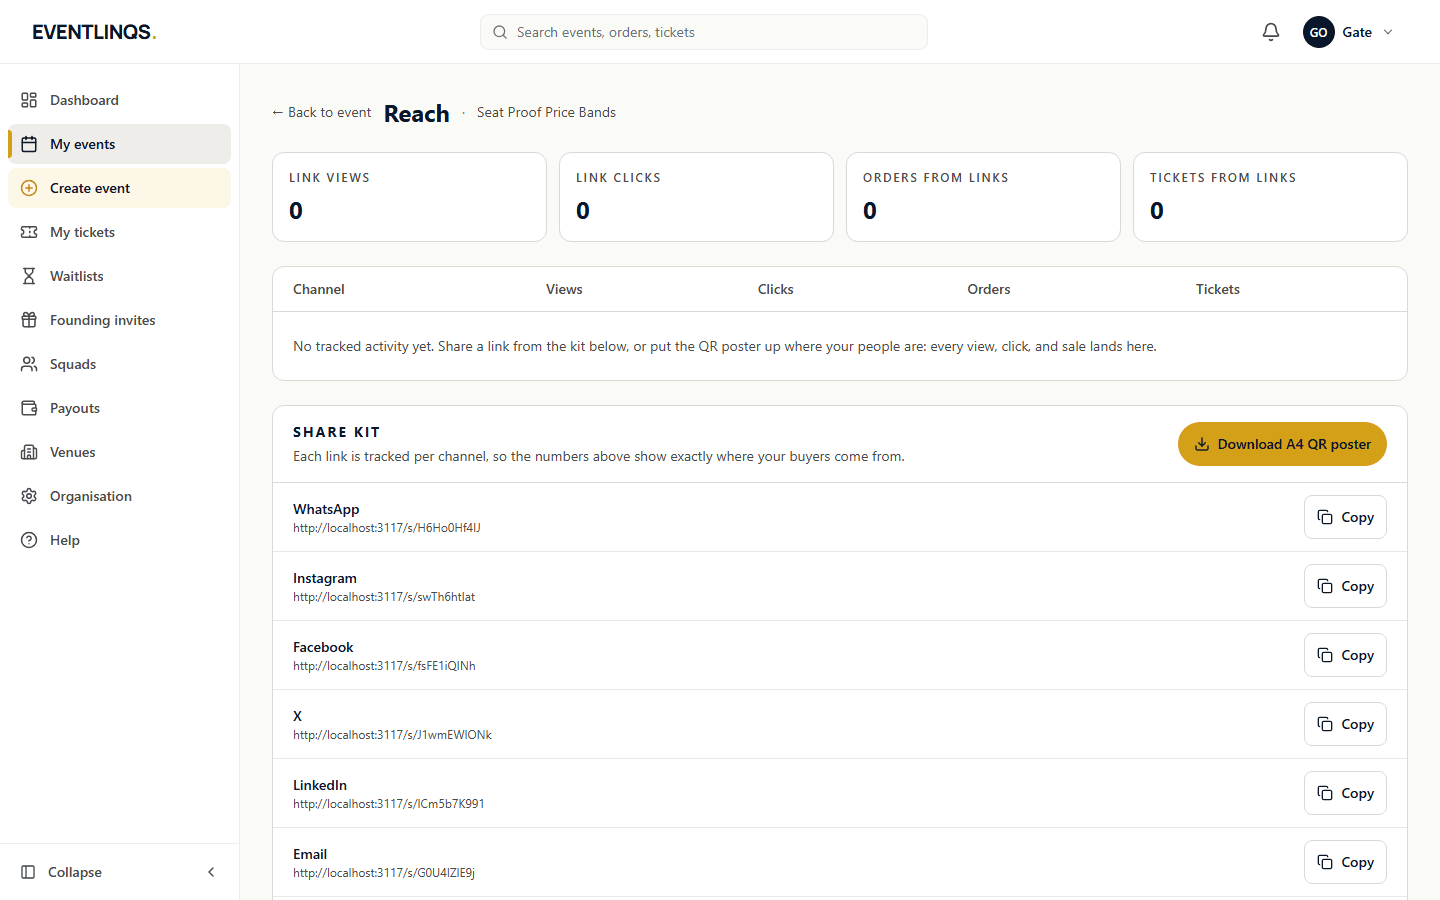
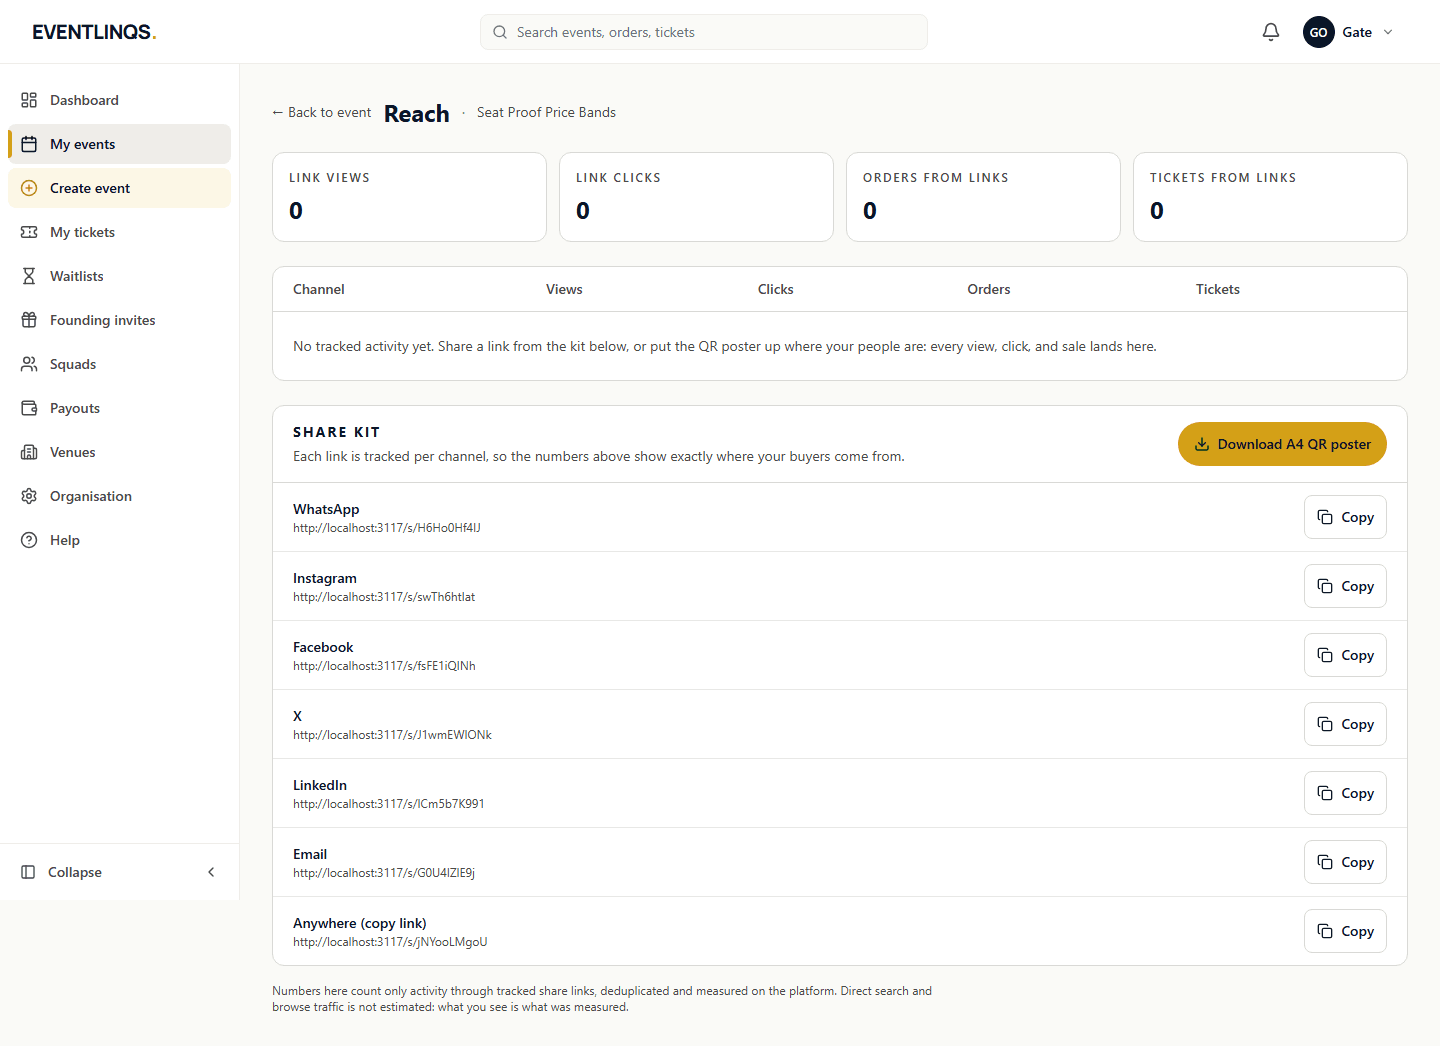
Open the event from your dashboard and choose Reach. Every tracked link you shared from the Launch Kit reports here, grouped by the channel it belongs to.
The four numbers
Views
Someone arrived at your event page through that link. Views are deduplicated per visitor per day, so one person refreshing eleven times is one view, not eleven. That makes the number smaller and worth more.
Clicks
Someone moved from your page toward buying. This is the gap that tells you whether the page is doing its job. Plenty of views with almost no clicks is a page problem, not a promotion problem.
Conversions
An order that completed, attributed to the last tracked link the buyer touched before they bought. Last touch is the honest simple model: it credits the channel that closed, not the one that started.
Tickets
How many tickets those orders carried. One conversion can be six tickets. When you are deciding where to put effort, tickets is usually the number that matters and conversions is the one that flatters.
How to actually read it
- Compare rates, not totals. A channel with 40 views and 8 tickets is beating one with 900 views and 9 tickets, and it is where your next hour should go.
- Watch the view-to-click step. If it is weak everywhere, the problem is the event page, most often the cover image or an unclear price.
- Watch the click-to-conversion step. If it is weak everywhere, the problem is at the point of buying: price, availability, or a ticket type that is confusing.
- Give it more than a day. A single evening of numbers is noise, and acting on noise is how promotion budgets get wasted.
- Look at it again a week after the event. The pattern you find there is the plan for the next one.
Read next
Promote and sell
Publishing and sharing your promo kit
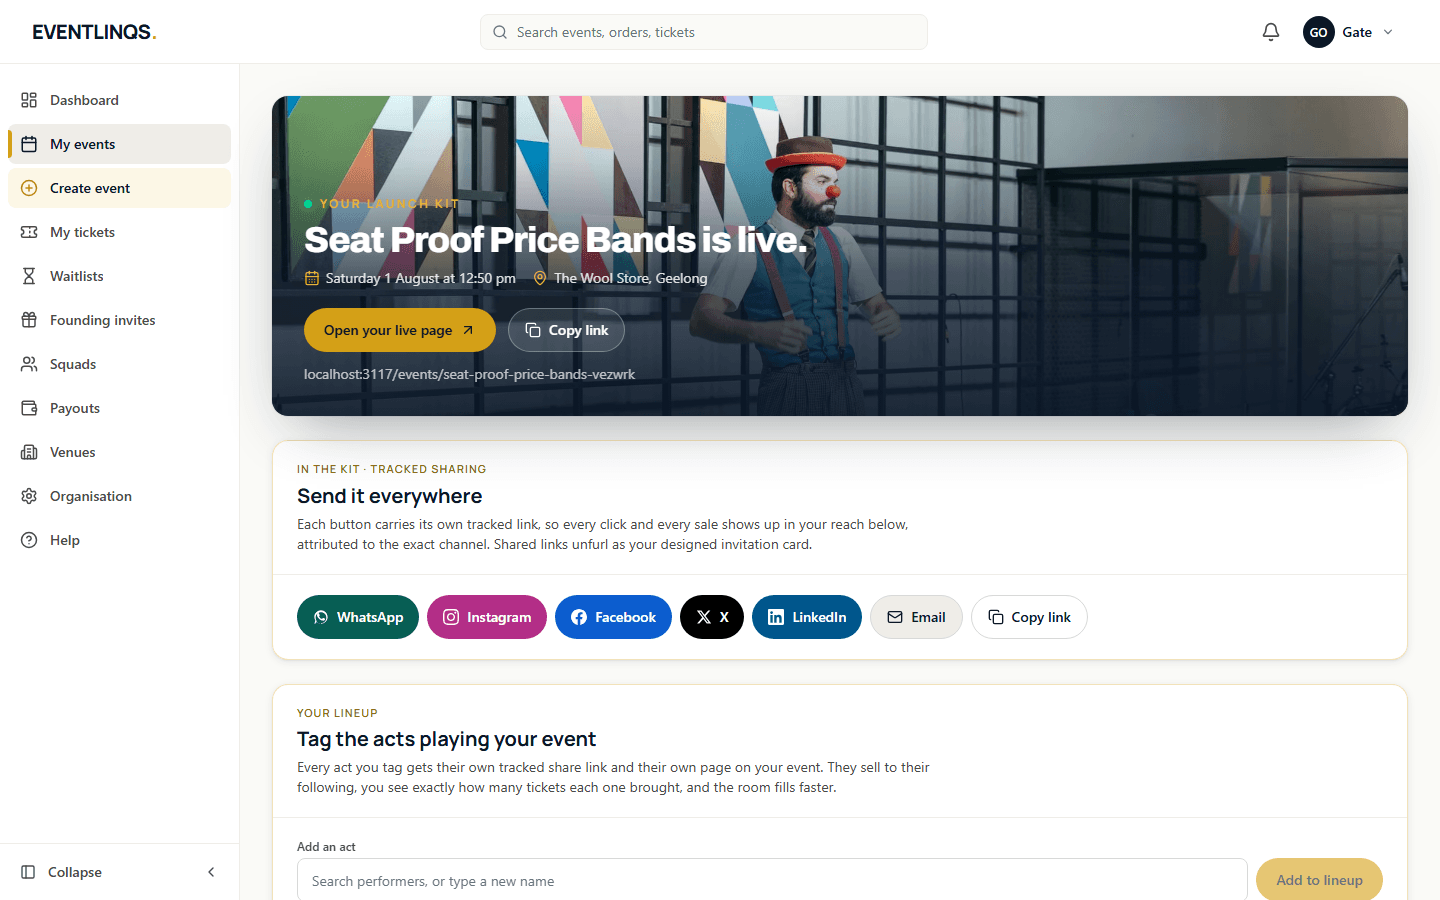
The moment you publish, your event gets a kit: tracked share links for every channel, a printable QR poster and an invitation card that unfurls wherever you paste the link.
6 min read
Set up your event
Creating your first event
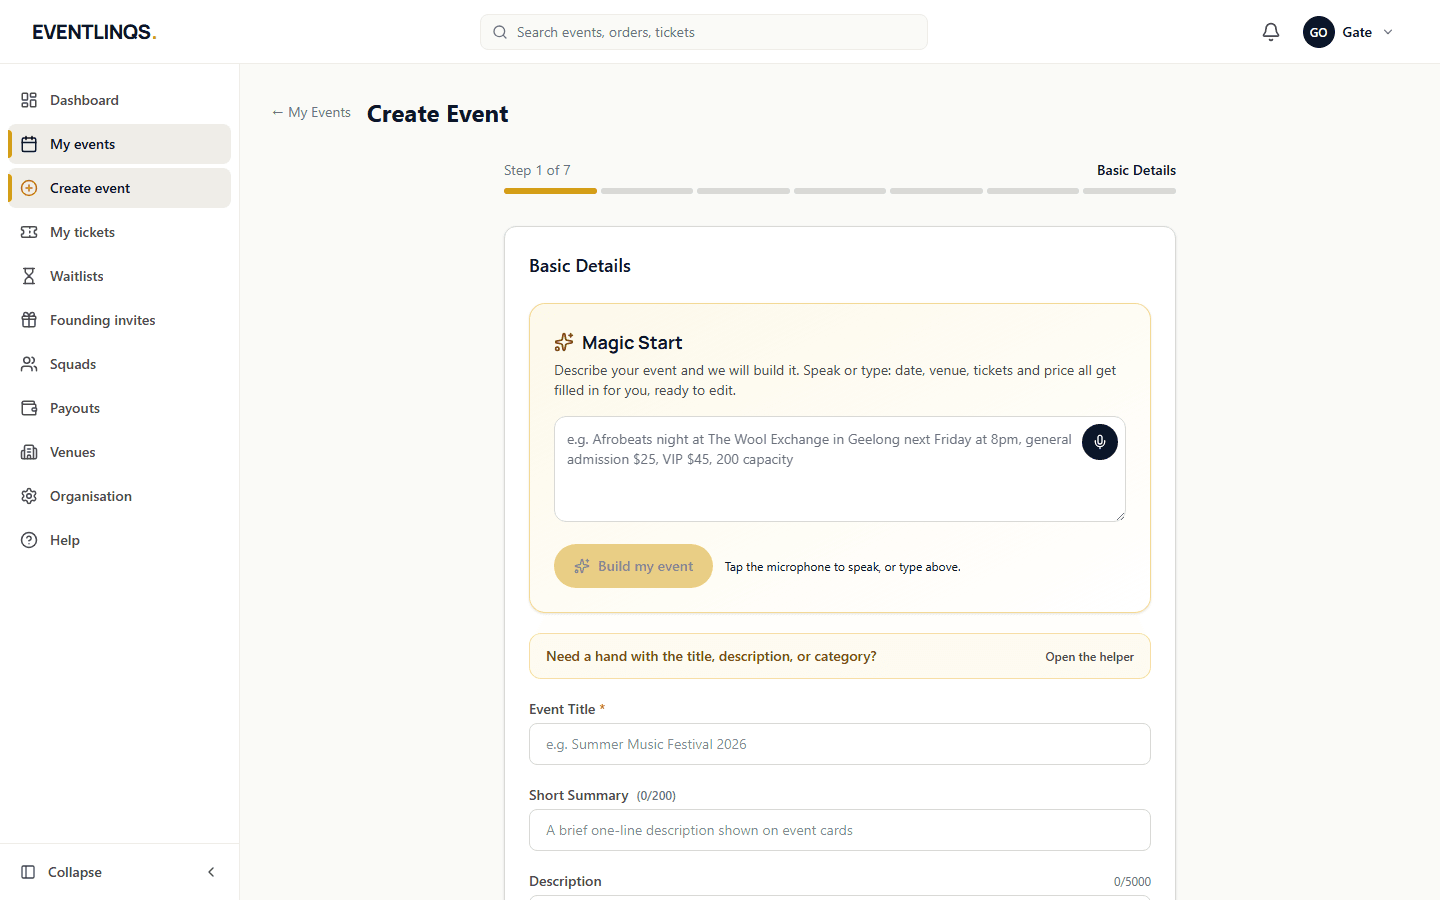
The seven steps from an empty dashboard to an event page that is ready to publish, and what to get right at each one.
7 min read
Money and payouts
Getting paid and payout timing
Where the money sits between the sale and your bank account, what is taken out, and exactly when it moves.
8 min read
Does this match what you are seeing?
These guides are checked against the running platform, and every screenshot on this page was taken from it. If a screen has moved since, tell us and we will correct the guide as well as help you.